Cities across the nation have unique stories about how they navigate fiscal challenges and population shifts in the post-pandemic era. While some cities are booming with revenue growth, others are seeing sharp declines in population and tax revenues.
As part of the annual City Fiscal Conditions research, the National League of Cities (NLC) collected budgetary data on 263 cities for fiscal years 2022, 2023 and 2024. For this article, we will limit our attention to the data collected for Fiscal Year 2023 since it was the most recent audited financial data at the time the data was collected.
We examine two key categories of cities: Growing Population Cities and Declining Population Cities. A city is classified as growing if its population increased between the 2010 and 2020 decennial censuses, and as declining if its population decreased over the same period. In addition, we will explore how general fund revenues, expenditures and tax structures vary across cities of different population sizes, using per capita data from Fiscal Year 2023.
General Fund Trends Across Various Population Categories
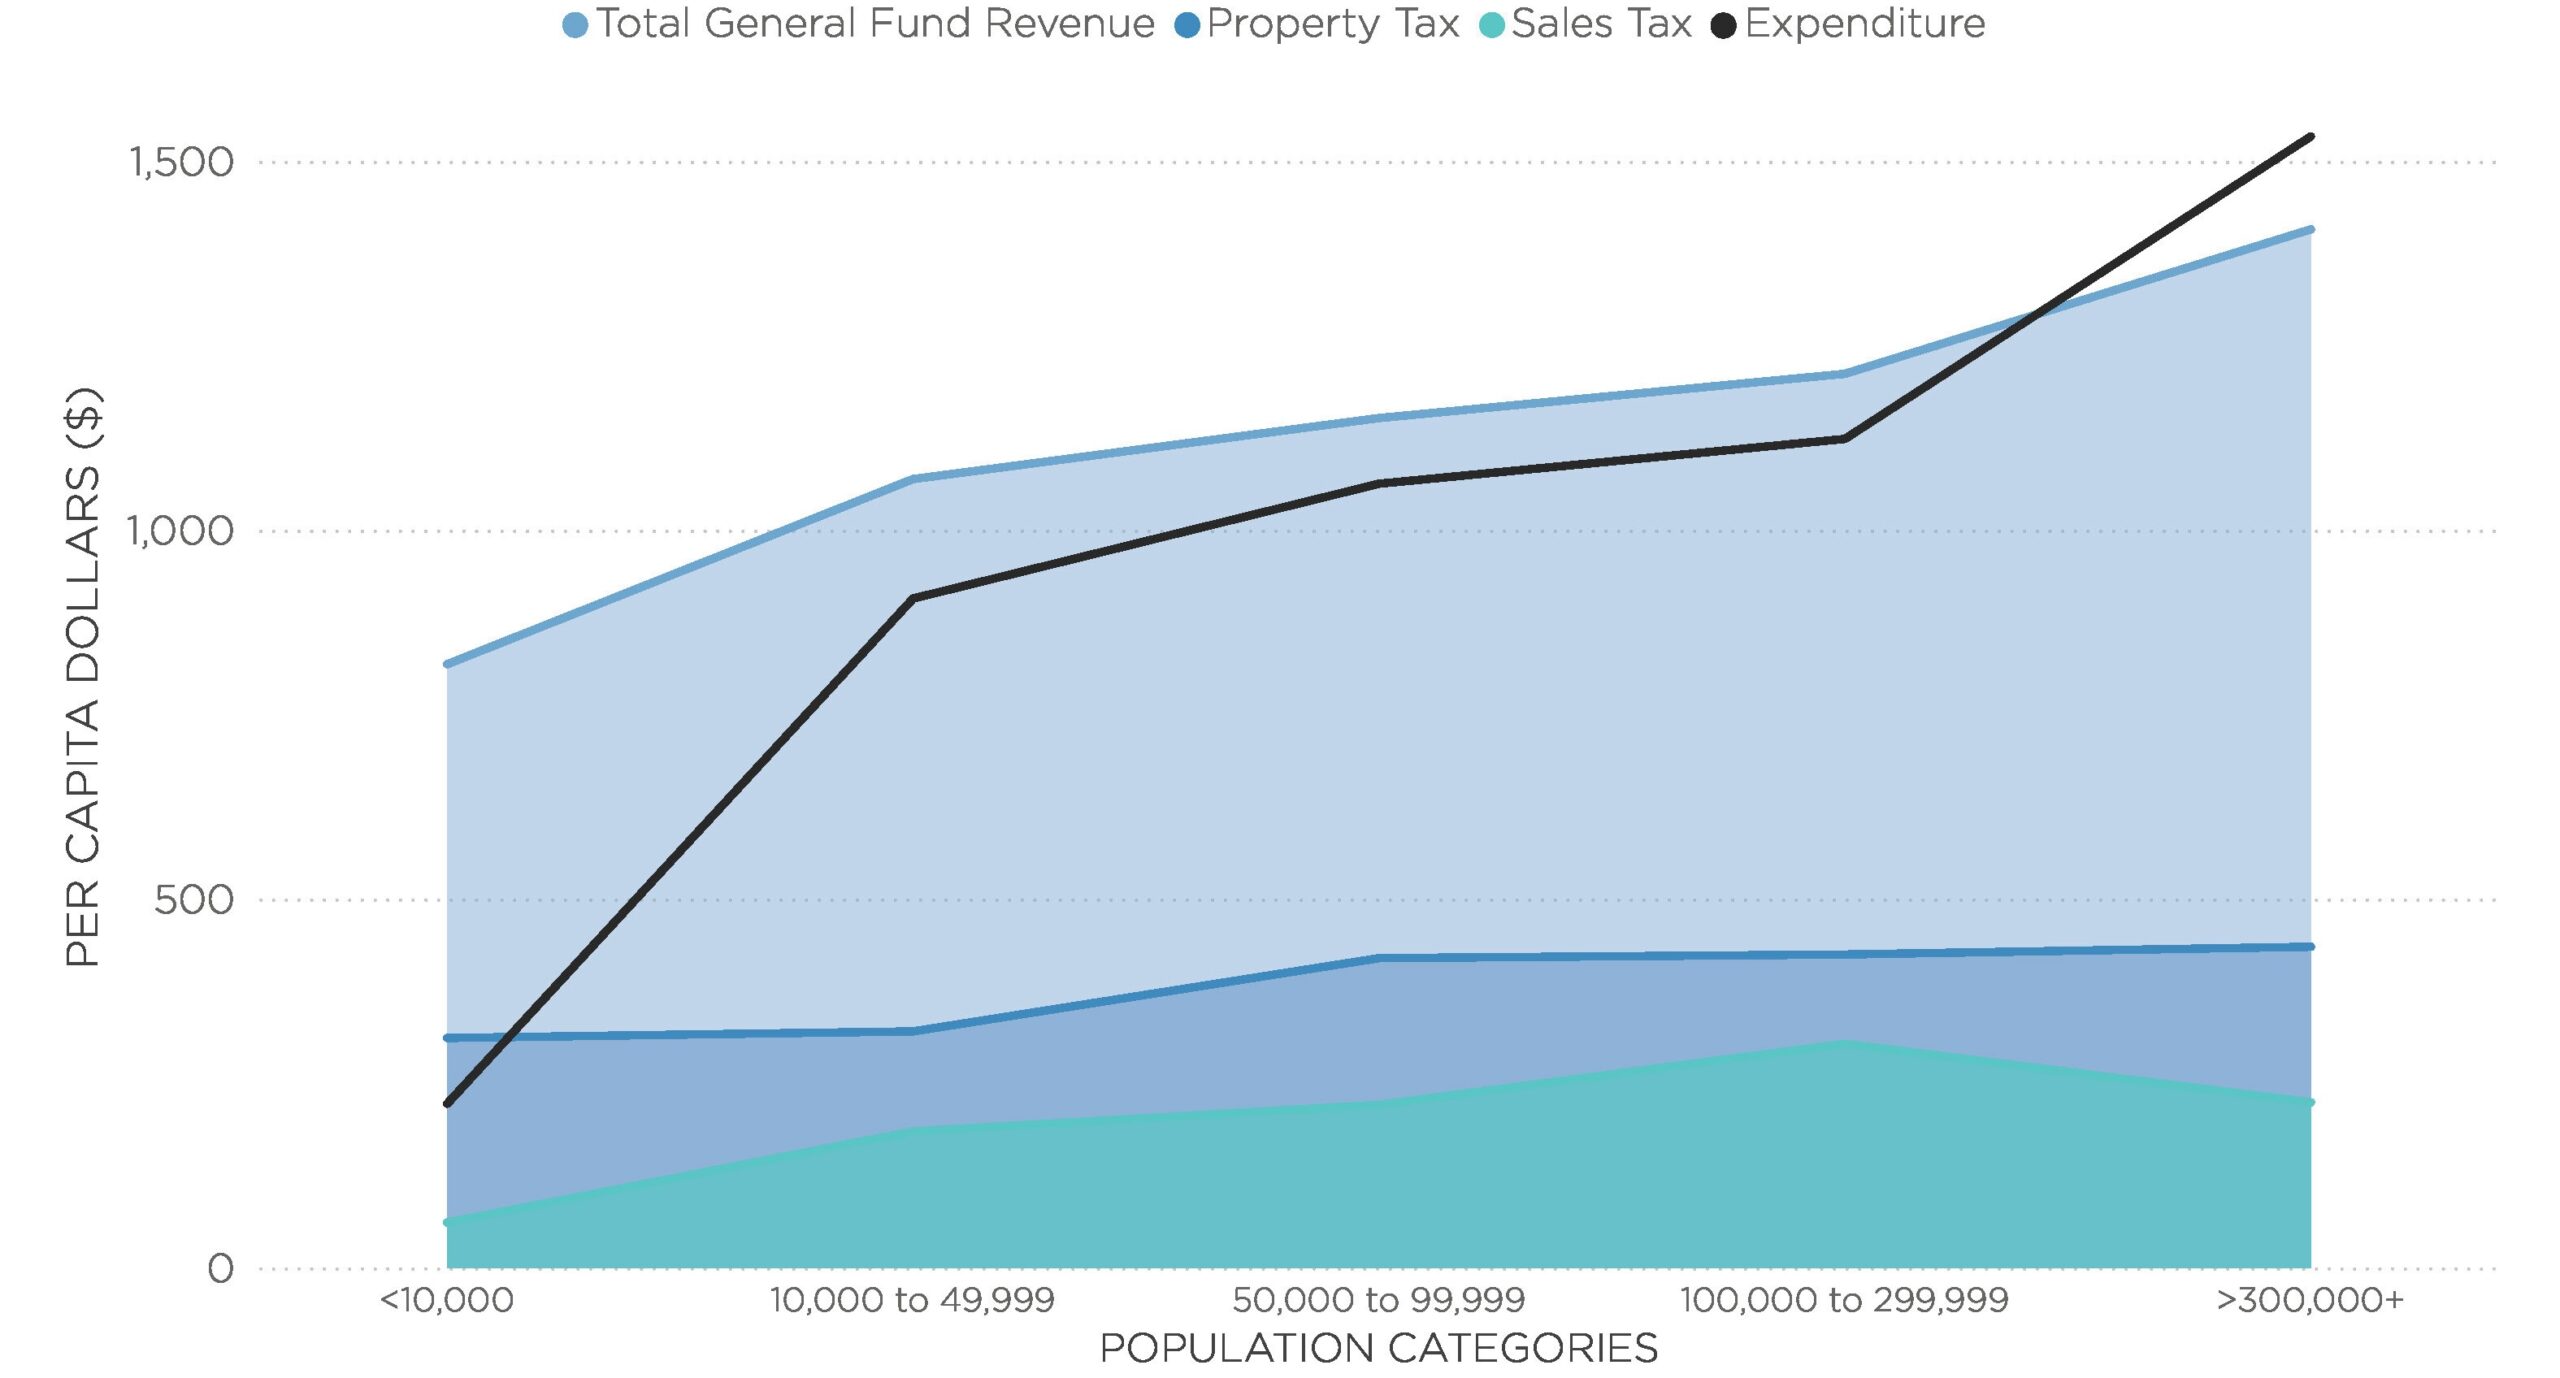
Larger cities, particularly with populations exceeding three million, generate the highest per capita general fund revenues reaching $1,407 and expenditures at $1,270 reflecting broader service demands and economic complexity.
Larger Cities Generate Highest Revenue
2023 Per Capita General Funds, by Population Categories

Interestingly, property tax revenue remains relatively stable across all city sizes, underscoring its role as a foundational funding source. Sales tax revenue per capita is at its highest amongst mid-sized cities (100,000 to 299,999 population size), likely due to improved commercial activity and increase in tourism. These trends highlight how city size influences not just the scale of budgets but also the composition of municipal revenue streams.
Growing Cities Bring in More Tax Revenue
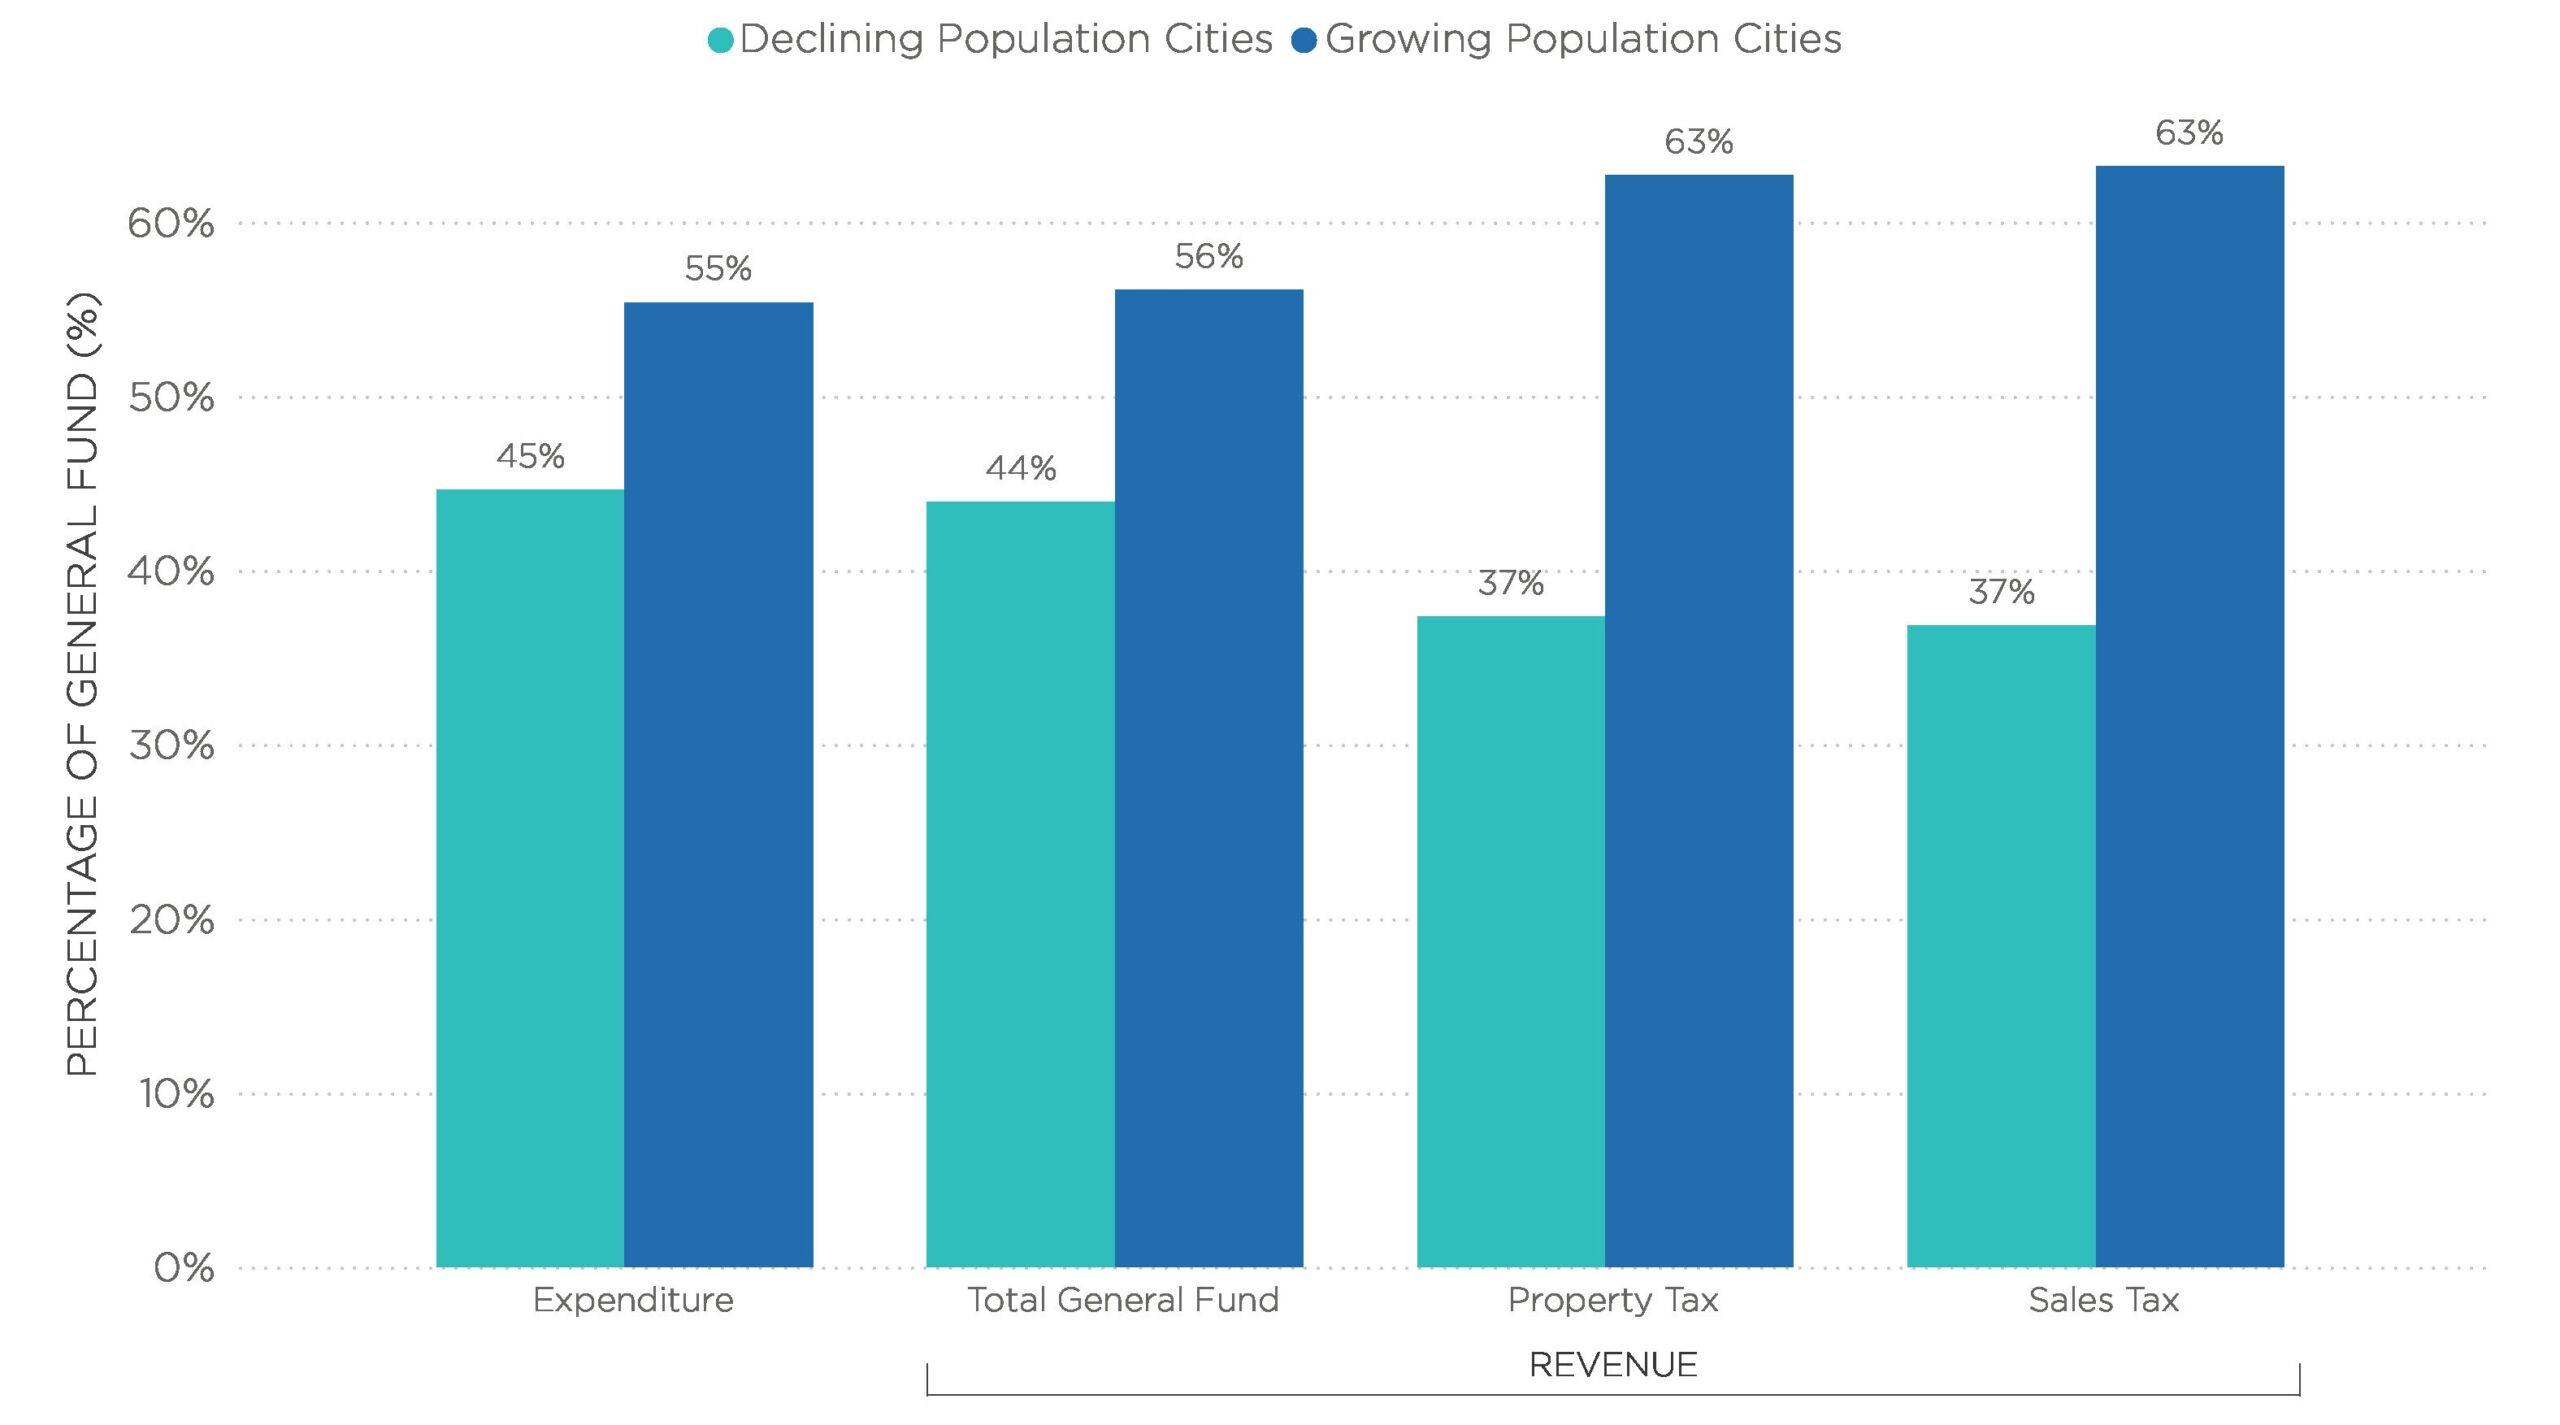
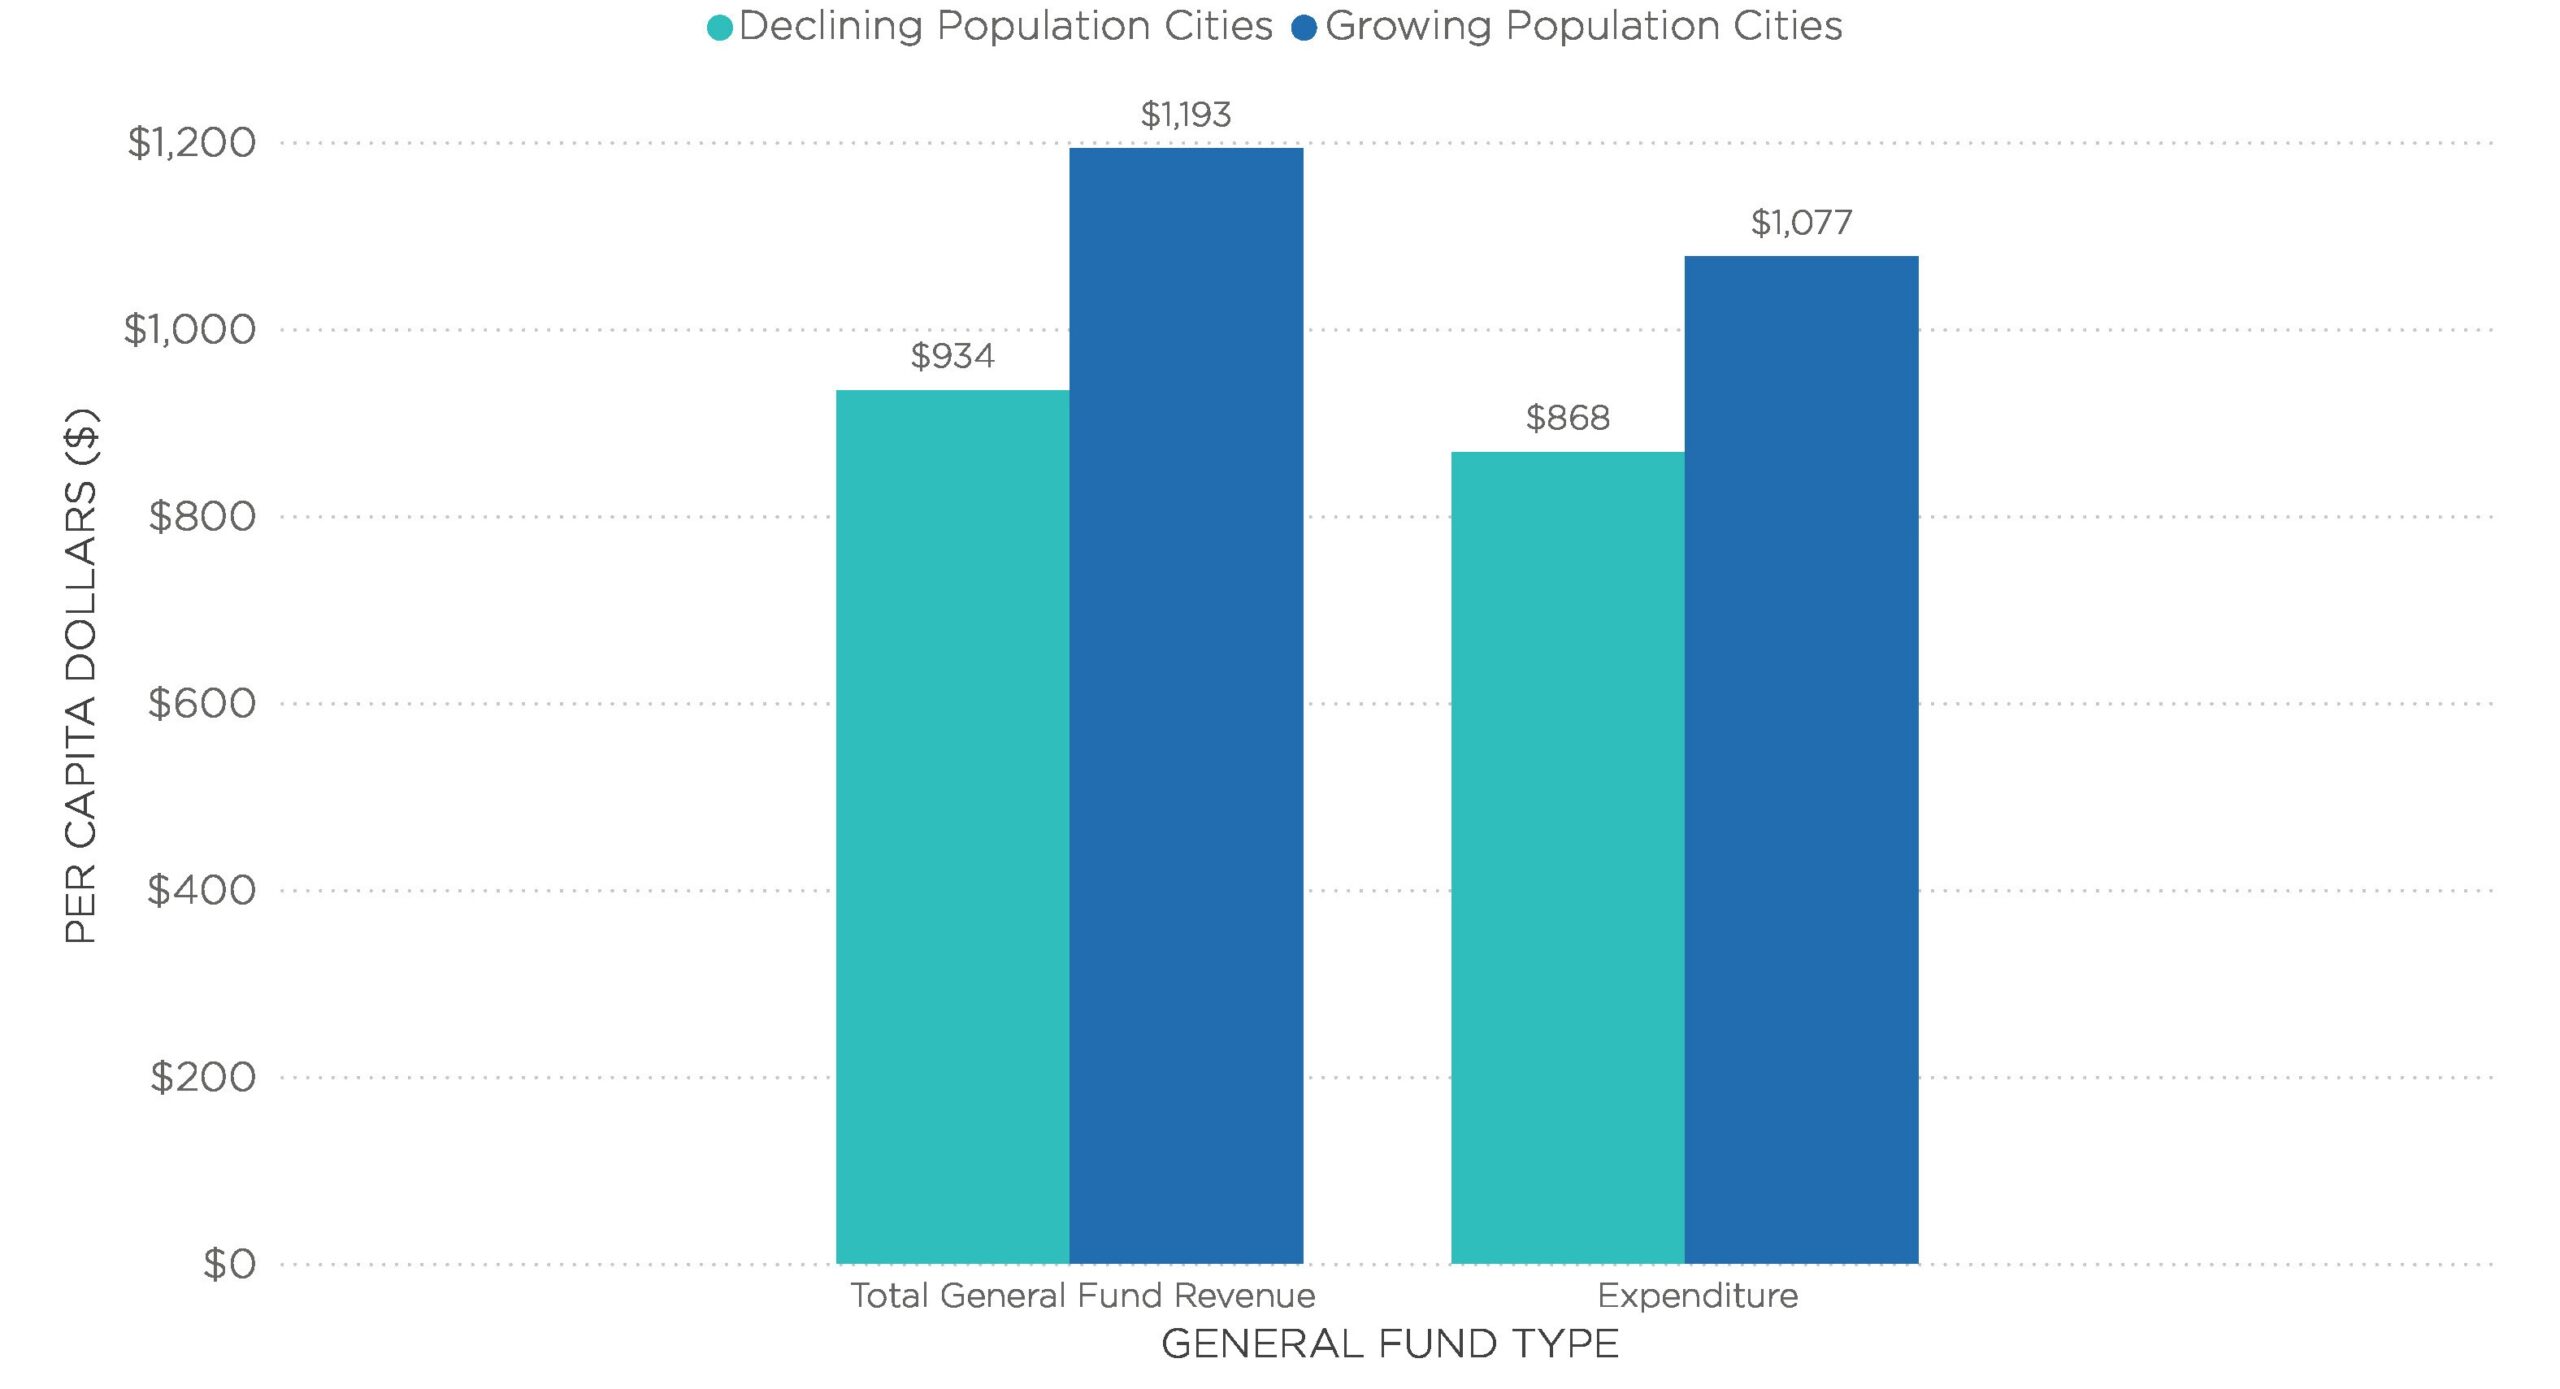
Building on the population-based analysis, another compelling dimension of city finances emerges when we compare cities with growing populations to those experiencing decline. Cities with growing populations account for a larger share of per capita general fund activity, contributing 56 percent of total general fund revenue and 55 percent of total expenditures with a per capita revenue of $1,193 and expenditures of $1,077 — both notably higher than the $934 in revenue and $868 in spending seen in cities with declining populations. This suggests that population growth is closely tied to fiscal vitality, likely driven by increased economic activity, a broader tax base, and greater demand for public services.
Notably, growing cities generate 62 percent of all property tax revenue and 63 percent of sales tax revenue, indicating that expanding communities not only attract more residents but also foster stronger real estate markets and consumer spending.
Growing Cities Bring in More Revenue
Percentage of General Fund Per Capita for Fiscal Year 2023, by Revenue Type

In contrast, declining cities contribute less across all categories, reflecting the fiscal challenges that often accompany population loss, such as reduced tax collections and constrained budgets. This contrast underscores the importance of demographic trends in shaping municipal financial health.
Population Growth Shapes City Revenue and Expenditure
Revenue and Expenditure Per Capita for Fiscal Year 2023, by Population

This gap underscores the economic vitality that often accompanies population growth, enabling municipalities to invest more in public services, infrastructure and community development. Cities facing population decline may struggle with shrinking tax bases and tighter budgets, limiting their ability to maintain or expand services. This financial disparity highlights the critical link between demographic trends and municipal fiscal health.
Financial Cushion: Growing Population Cities Are Better Prepared for the Unknown
One of the most telling indicators of a city’s financial health is its ending balance — the funds left after all revenues and expenditures are accounted for. Cities with growing populations boast a significantly higher average ending balance of $566 per capita, compared to just $438 in cities with declining populations.
This surplus acts as a financial cushion, enabling growing cities to better respond to emergencies, and invest in long-term infrastructure and community development. In contrast, cities with declining populations may find themselves with limited reserves, making them more vulnerable to fiscal shocks. Simply put, more reserves mean a healthier fiscal outlook, especially in an uncertain future where adaptability and preparedness are key to sustainable governance.
NLC’s City Fiscal Conditions 2024 reveals that both city size and population trends play a critical role in shaping municipal fiscal health. Larger cities consistently report higher per capita revenues and expenditures, benefiting from economies of scale and diversified tax bases.
Meanwhile, cities with growing populations outperform their declining counterparts across nearly every financial metric — from general fund revenue and expenditure to property and sales tax collections. Perhaps the most telling is the difference in ending balances: growing cities maintain larger reserves, positioning them to better navigate economic uncertainty and invest in future growth.


