Last month, the Treasury Department released the most up-to-date snapshot of how $350 billion of the American Rescue Plan Act’s (ARPA) State and Local Fiscal Recovery Funds (SLFRF) are being spent. The new data provides a fresh look at how large cities and counties—which received $65 billion in total—are budgeting the second half of their SLFRF dollars, which Treasury distributed in May.
Over the past six months, our Local Government ARPA Investment Tracker has been monitoring how 330 large cities and counties are using these resources to stabilize government operations and address the COVID-19 pandemic’s health and economic effects. This piece provides updates on ARPA commitments and expenditures through June 30, 2022.
Local Cities and Counties have Committed 61% of their Allocations
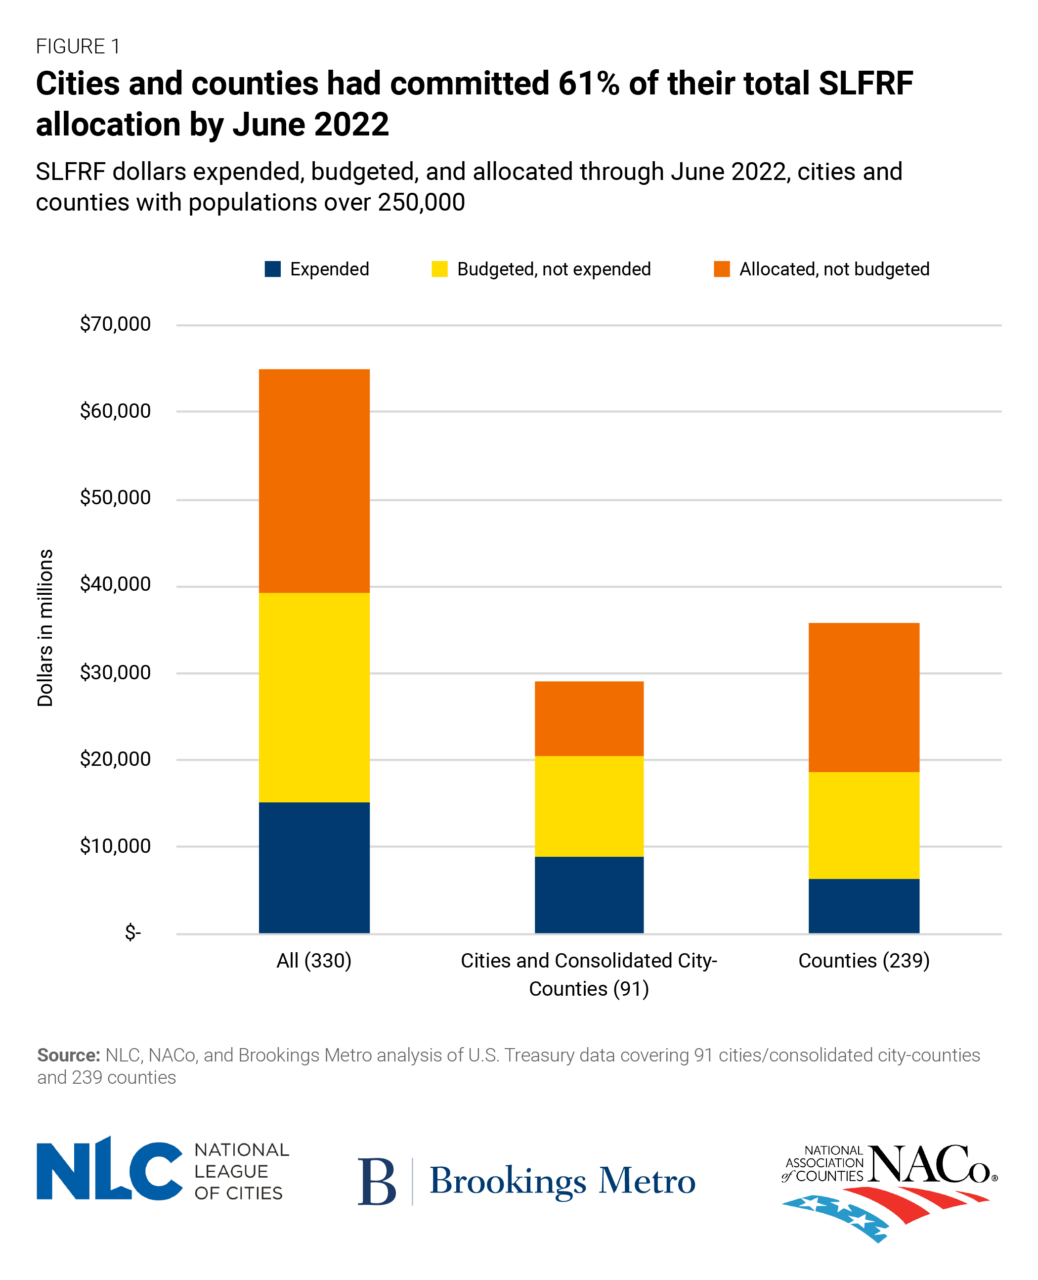
Local governments have until the end of 2024 to budget and obligate their SLFRF allocations, which means they were about one-third through that timeline as of June 30. By then, large cities and counties (91 cities/consolidated counties and 239 counties with populations over 250,000) had committed SLFRF dollars to roughly 7,500 projects—a 21% increase since the end of March 2022.
Funding commitments grew as well. The total share of committed SLFRF dollars increased from 51% at the end of March to 61% at the end of June. This means that, as a group, large cities and counties have budgeted the entirety of their first tranche of funding and are beginning to allocate the second tranche they received in May.
Cities were a bit further ahead in budgeting than counties in our analysis. Large cities/consolidated counties have budgeted 71% of their SLFRF allocations—nearly 20 percentage points higher than counties, which have budgeted 52%.
Overall, by June, $39 billion in SLFRF dollars allocated to these local governments have been budgeted or spent, with $26 billion remaining to be obligated by December 2024 and spent by 2026.
Over 43% of Committed Funds are Going to Government Operations
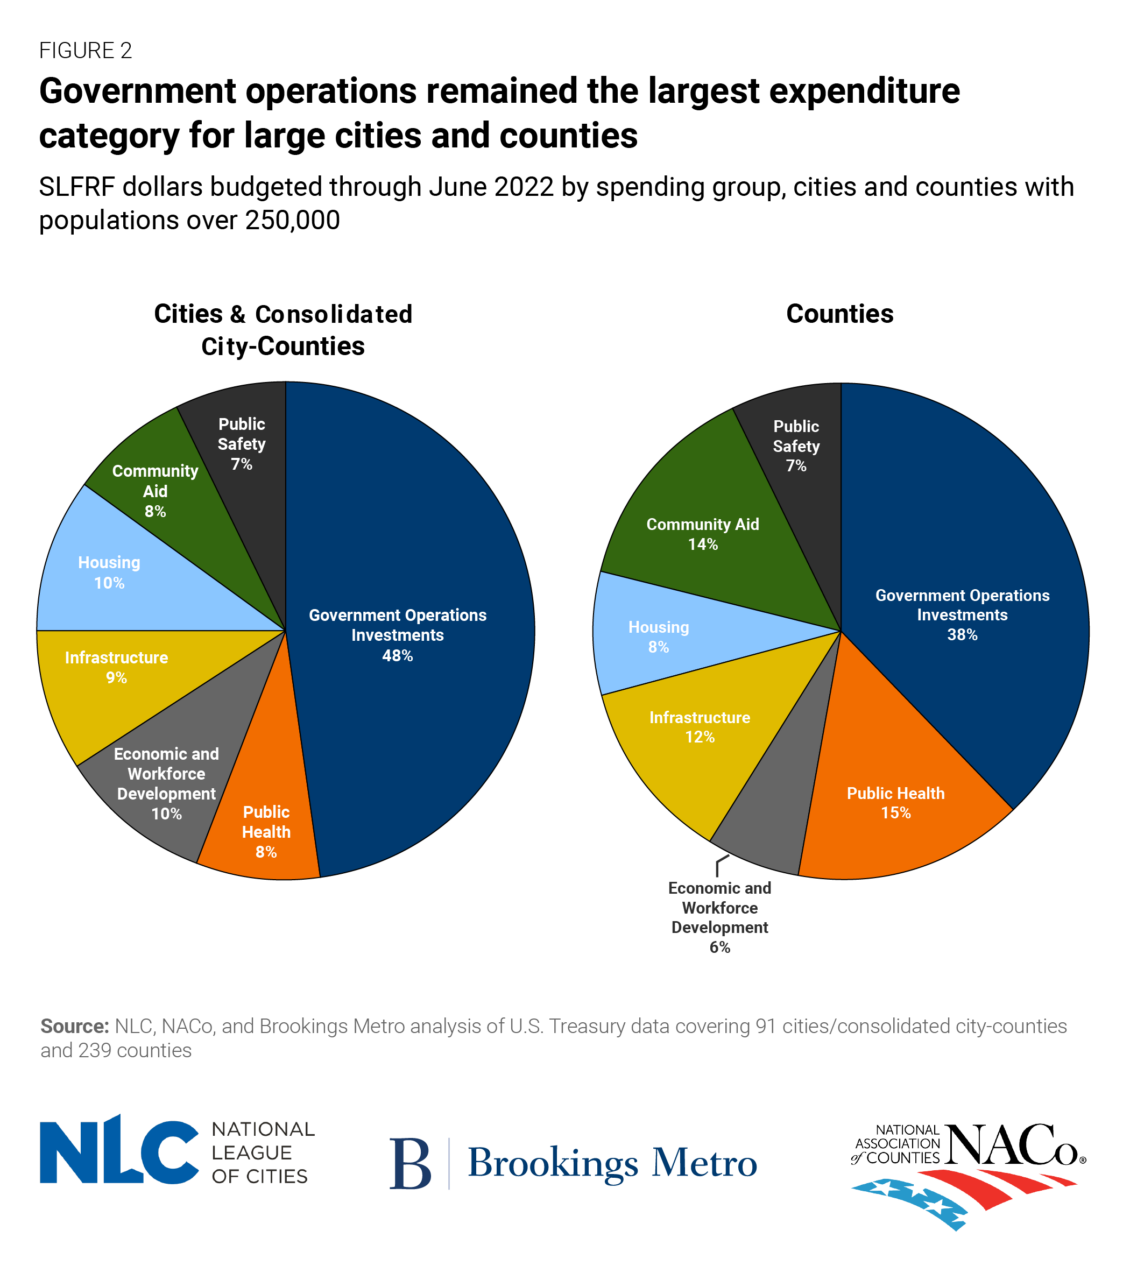
In our previous analysis of ARPA data from March, the largest share of cities and counties’ SLFRF allocation went to stabilizing government operations, which includes fiscal health recovery, employee wages, and investment in facilities and equipment. The latest data suggests this pattern is relatively unchanged; government operations accounted for 43% of city and county commitments as of June 2022, down marginally from 44% in March.
However, there were some shifts in budgeting priorities between March and June. For counties, the share of funds committed to public health decreased from 17% to 15%, perhaps due to COVID-19’s waning impact on public health services. Meanwhile, the share of funding to community aid projects increased from 9% to 14%.
For cities/consolidated counties, priorities remained remarkably similar across our major categories. About half of budgeted funds are still going to government operations, with the remainder evenly split across the six remaining categories.
Large Counties and Cities have spent 23% of their SLFRF Dollars
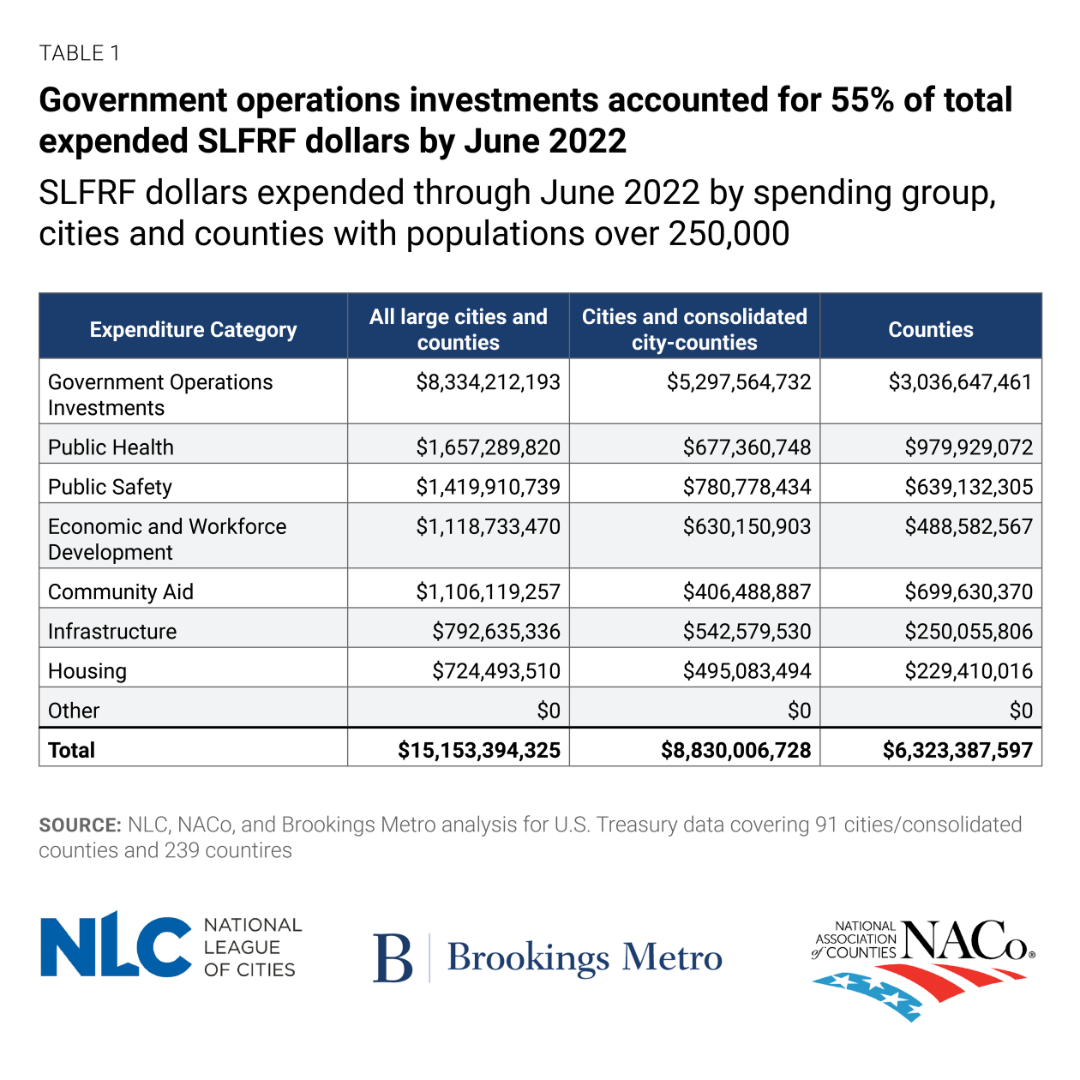
As of June 30, large cities and counties have spent $15 billion in SLFRF dollars—nearly one-quarter of their $65 billion allocation. Expenditures increased by 36% between March 2022 and June 2022. Notably, large cities/consolidated counties have spent a higher share of their funds than large counties (30% versus 18%), which is consistent with the faster rate at which those governments have budgeted the dollars.
SLFRF commitments indicate what areas local governments are prioritizing, but expenditure data provides a sense of where those funds are displaying an initial impact. For cities/consolidated counties, government operations accounts for 48% of commitments but 60% of expenditures thus far. This trend also holds for large counties (38% committed but 48% expended). Indeed, local governments are likely finding it easier to move resources quickly through existing operations rather than standing up new programmatic investments. And because cities/consolidated counties have higher shares of their overall commitments and expenditures in government operations, that may account for their faster expenditure rate.
Beyond government operations, however, large cities and counties are also expending large investments to build livable communities and vibrant local economies though economic and workforce development ($1.1 billion); community aid ($1.1 billion); infrastructure ($792 million); and housing ($725 million).
Large Cities and Counties Continue to Budget about 30% of Funds Toward Addressing Social and Economic Disadvantage
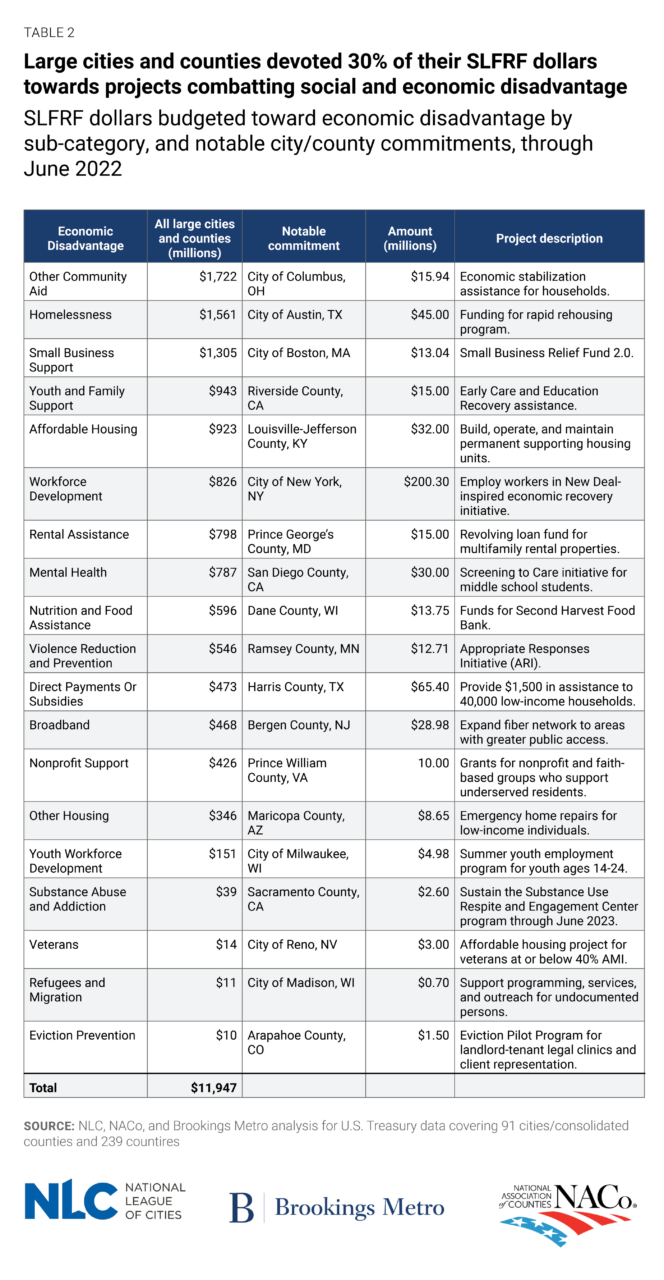
This March, about 29% of SLFRF commitments were concentrated in 19 project groups aimed at addressing social and economic disadvantage. By June 30, that share increased to 30%, representing a $12 billion infusion of resources for equitable recovery. This portfolio includes $3.6 billion for affordable housing, rental assistance, anti-homelessness, eviction prevention, and other housing programs; $1.3 billion for stabilizing and strengthening small businesses; and $1 billion for workforce development and youth and family supports.
About 15% of local governments (47) in our analysis budgeted more than 50% of their SLFRF resources for projects addressing social and economic disadvantage. Fifteen local governments are committing more than 75% of their resources to these projects. Importantly, equitable ARPA spending approaches cut across every part of the country, including communities such as Madison, Wis. (98%); Lee County, Fla. (90%); and North Las Vegas, Nev. (89%).
With the new Treasury Department data, we now have a much fuller picture of how ARPA resources are being utilized. Yet past may not be prologue, and spending priorities for the second tranche of funds will likely look different than the first. With government operations stabilizing in the second half of 2022, the next round of reporting data will reveal the full extent of how governments are addressing the long-standing economic and social challenges exacerbated by the pandemic.
Note: The total number of local governments studied in this analysis has changed from 326 (90 cities/consolidated counties and 236 counties with populations over 250,000) in the March 2022 data to 330 (91 cities/consolidated counties and 239 counties with populations over 250,000) in the June 2022 data.
The authors thank Ricardo Aguilar, Christine Baker-Smith, Alan Berube, and Teryn Zmuda for research advice and support.
About the Authors
By Joseph Parilla, Glencora Haskins, Julia Bauer, and Sarah Edwards

